


Why Most Investors Are Leaving AI’s Full Potential on the Table
How to use structured AI prompts to get-scary good results with 5 real world examples

If you throw basic questions at ChatGPT and wonder why you get some generic output back, you’re not alone, most investors are using AI for research the wrong way.
But, the secret isn't which Large Language Model (LLM) you use, it's how you talk to it.
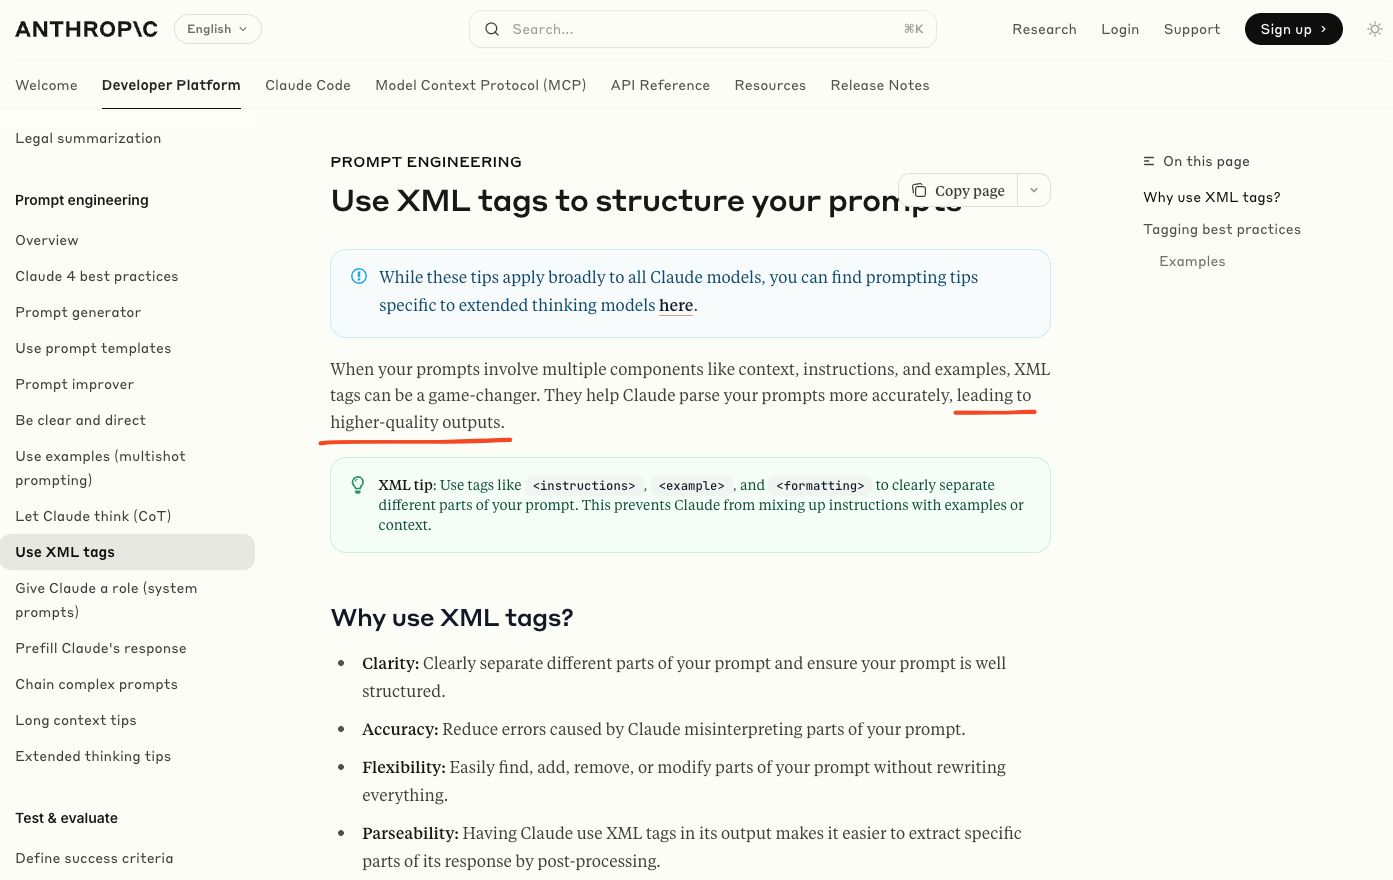
Why Prompt Structure Actually Matters
Think of it like this: You wouldn't walk up to a Wall Street analyst and just say "tell me about Apple stock," right? You'd give them specific instructions, timeframes, and exactly what kind of analysis you need.

Same principle applies to AI. Structure your prompts properly, by putting examples in <example> tags, instructions in <instruction> tags and so on, it helps the AI understand the role of the various types of information you're giving it.
Ok, let’s run a quick comparison.
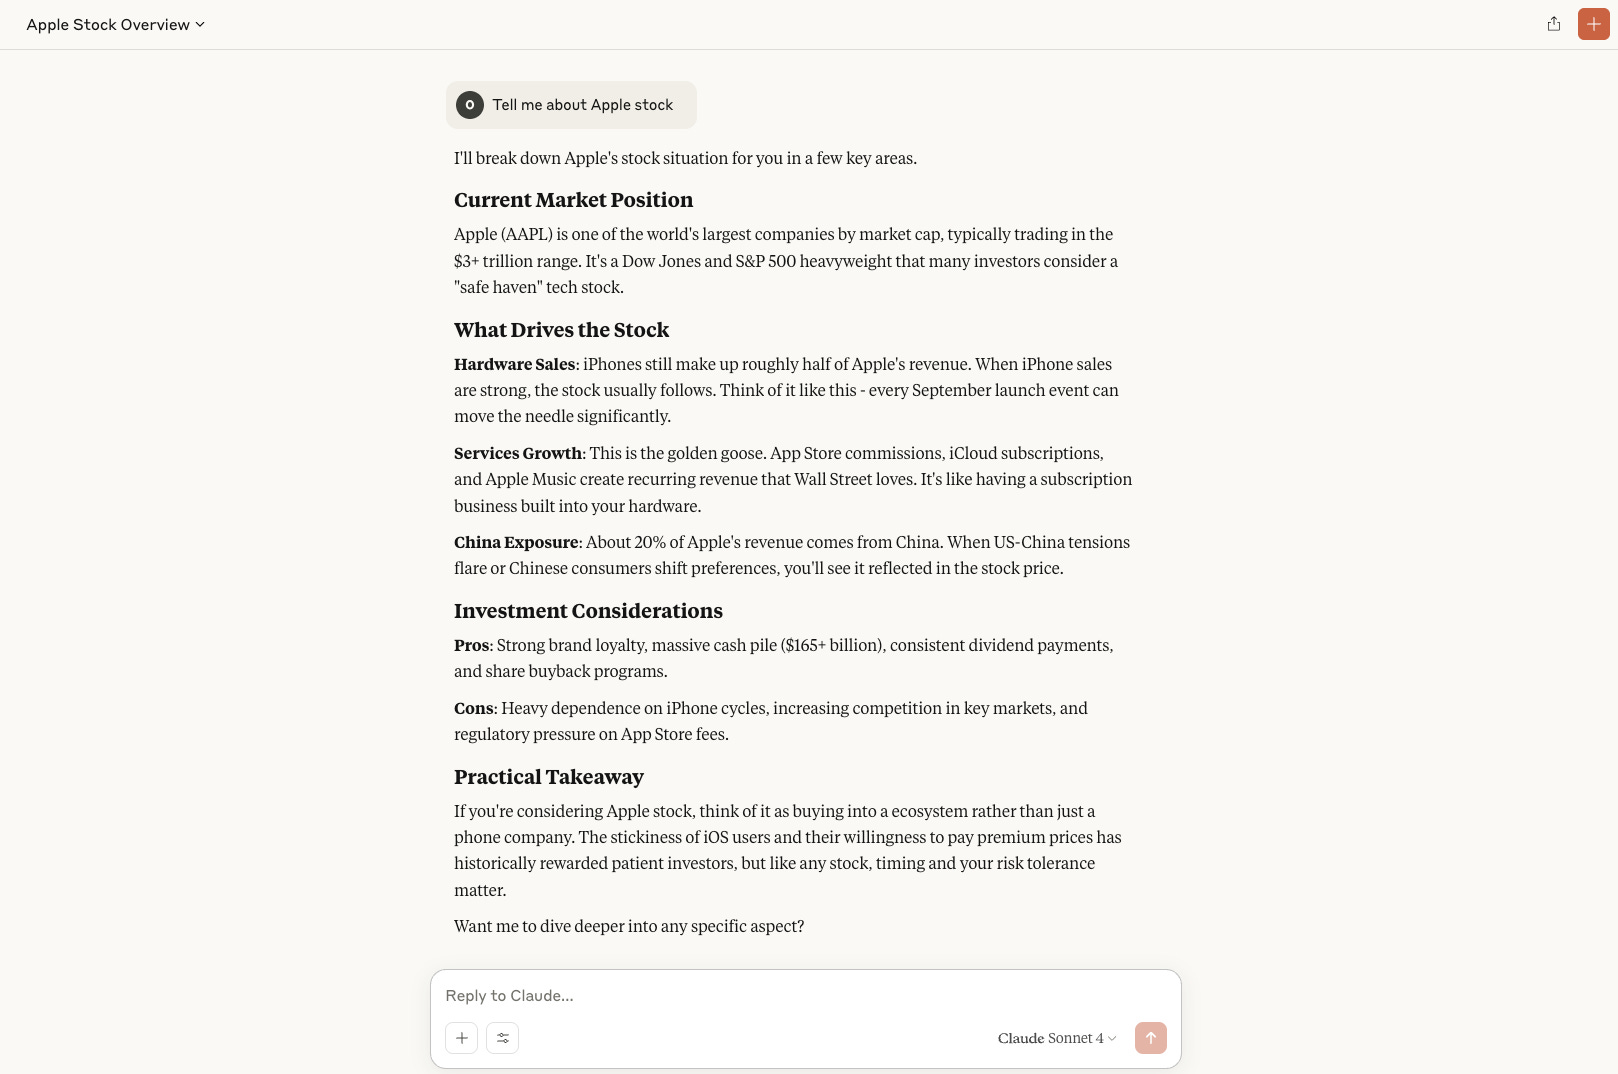
Basic Prompt: "Tell me about Apple stock"
Structured Prompt with XML Tags:
<role>Act as a senior equity analyst</role>
<task>Analyze Apple Inc. (AAPL) stock</task>
<format>
- Executive summary (2-3 sentences)
- Key financial metrics
- Competitive position
- Risk factors
- Investment thesis
</format>
<constraints>Focus on Q1 and Q2 2025 data, be objective, highlight both positives and negatives</constraints>
Output:
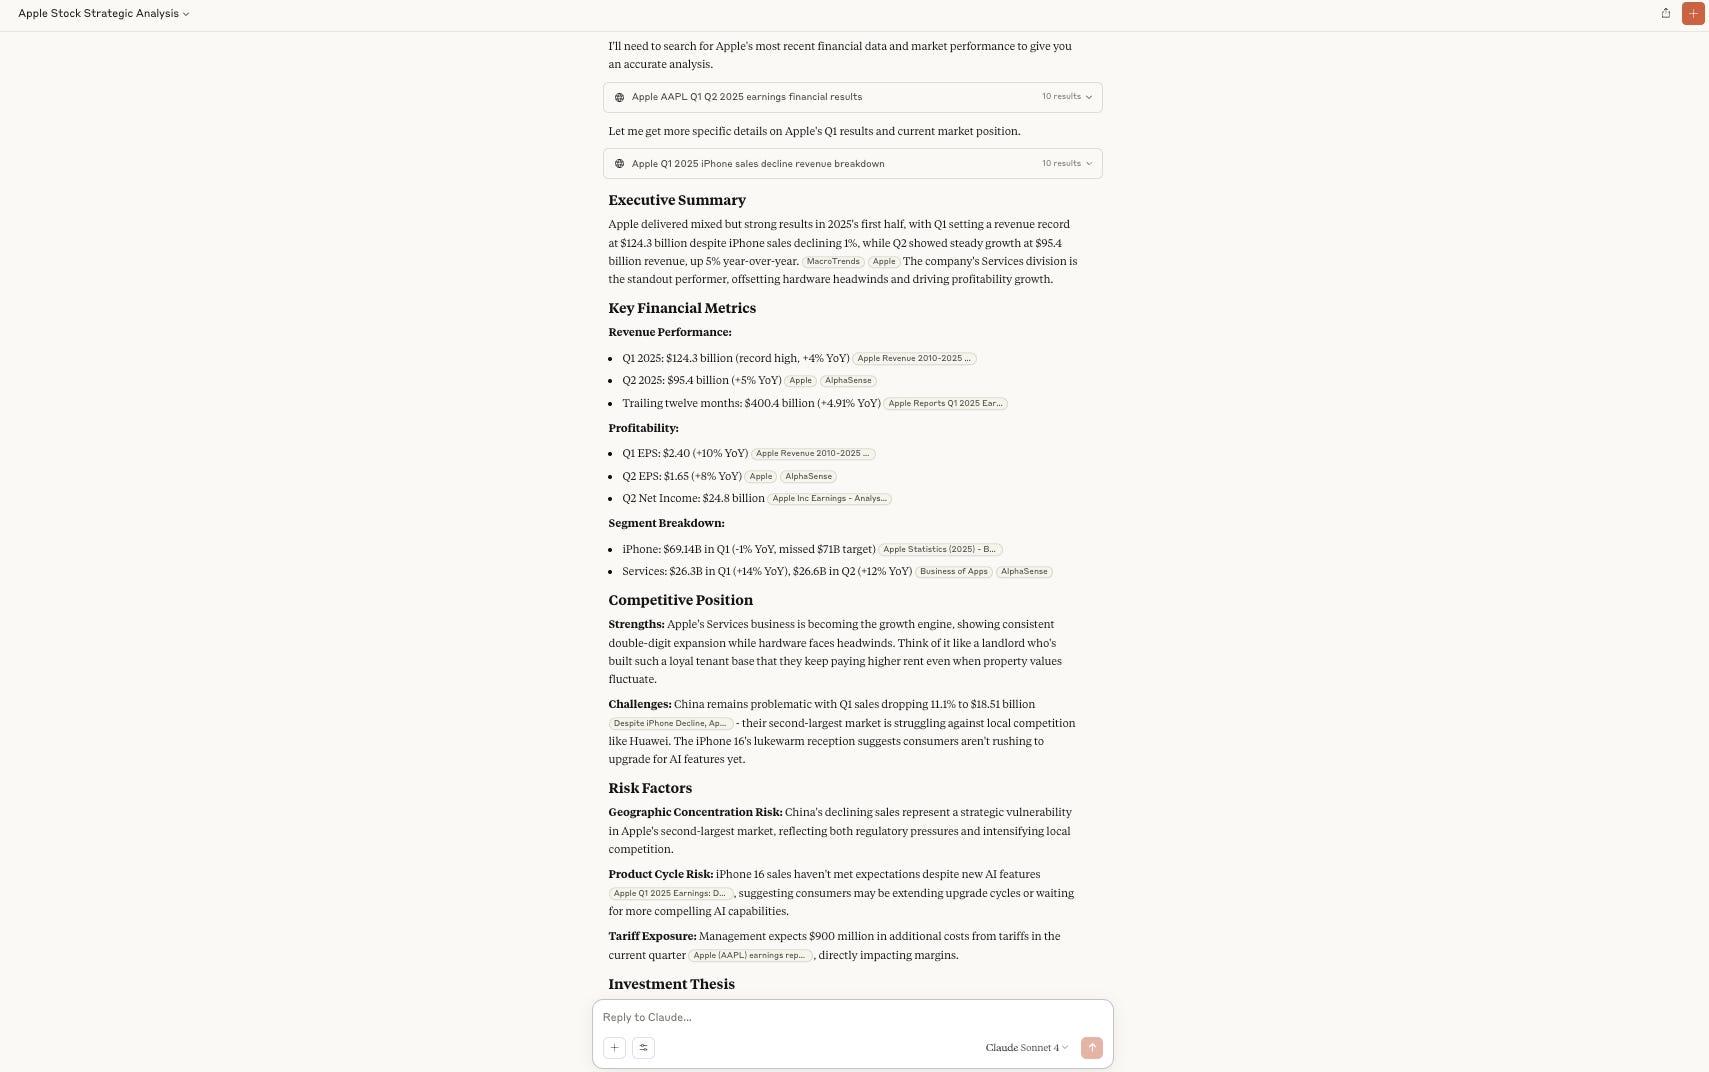
See the difference? The structured version gives you organized, actionable and predictable outputs instead of generic information dumps.
So, let’s see some real world examples.
Note: I use Claude for all the following examples, but the same structured approach works with ChatGPT, Gemini, or any other LLM.
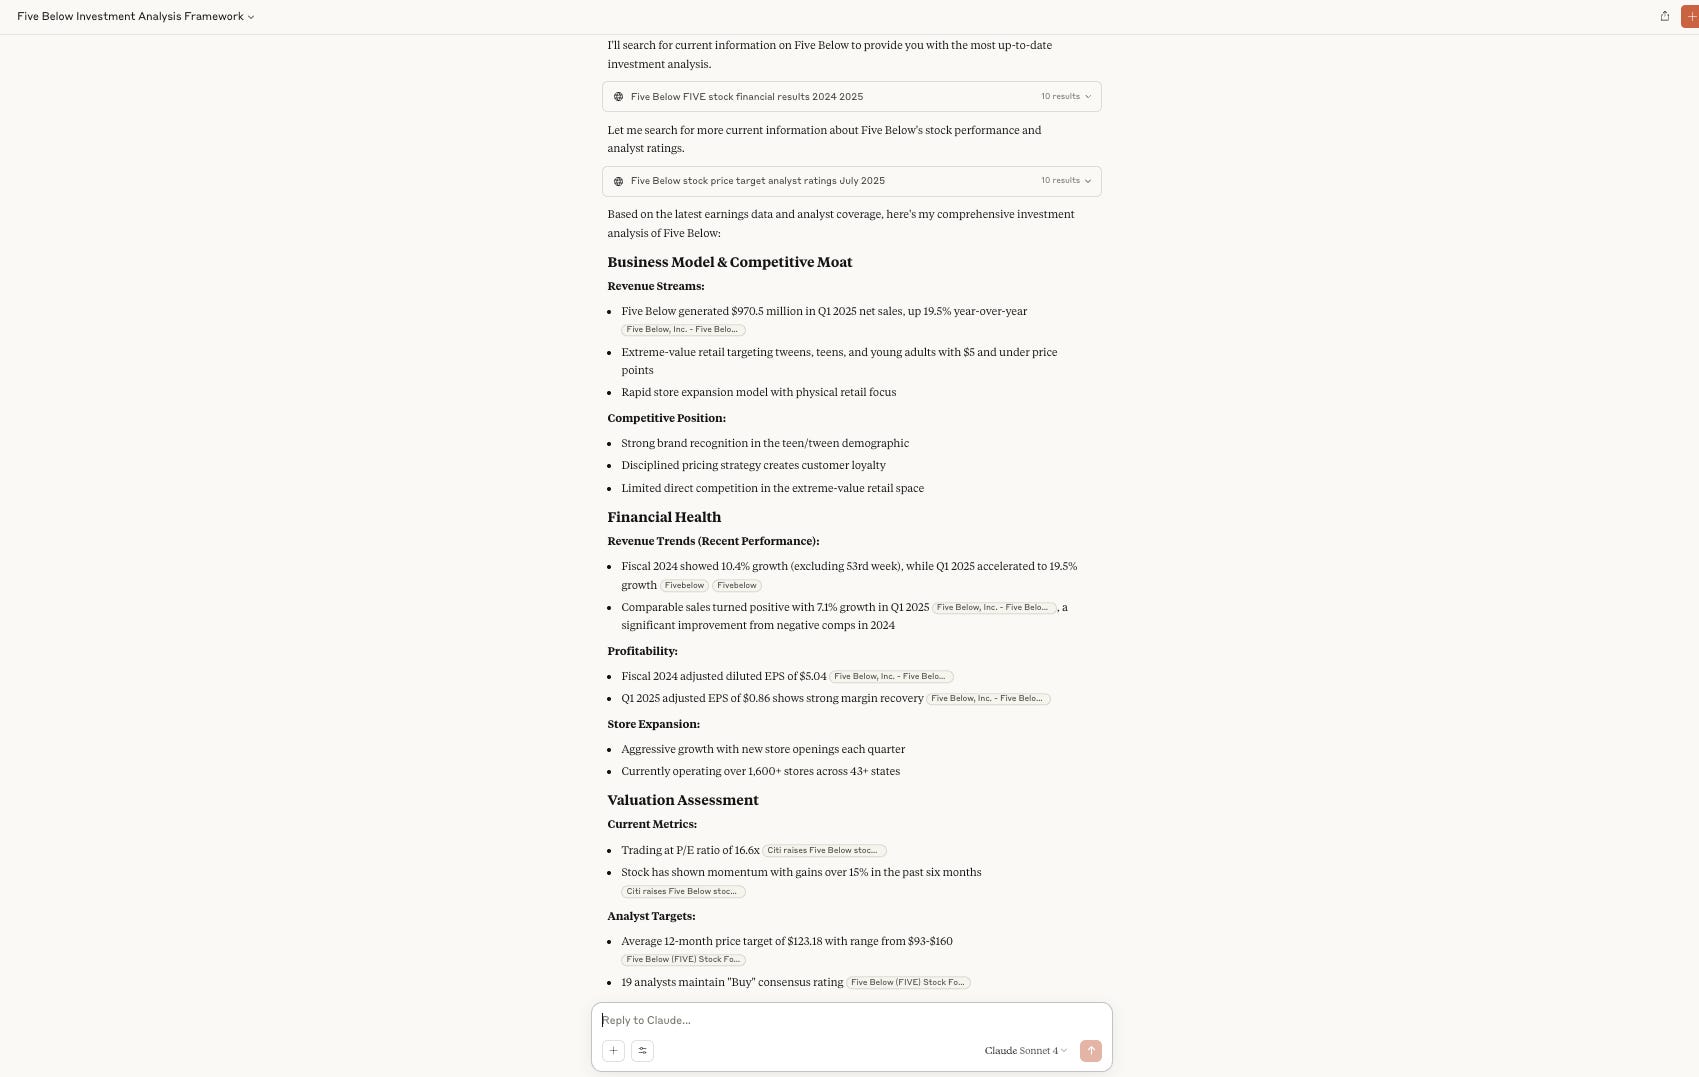
1. Company Analysis
This prompt breaks down companies like a professional analyst, quickly examining business operations, financial health, valuation, and investment potential.
<role>Senior equity research analyst with 10+ years experience</role>
<company>[COMPANY NAME]</company>
<task>Provide comprehensive investment analysis</task>

<analysis_framework>
**Business Model & Competitive Moat:**
- Revenue streams and sustainability
- Competitive advantages and threats

**Financial Health:**
- Revenue growth trends (3-year)
- Profit margins vs peers
- Debt levels and cash position
- Return on equity trends

**Valuation Assessment:**
- Current P/E vs historical average
- Price-to-sales vs industry

**Risk Assessment:**
- Top 3 business risks
- Regulatory/market headwinds
- Management quality signals

**Investment Thesis:**
- Bull case (3 strongest points)
- Bear case (3 main concerns)
- 12-month price target reasoning
</analysis_framework>

<output_format>Use bullet points, include specific numbers where available, cite recent earnings calls or SEC filings when relevant</output_format>
Output:
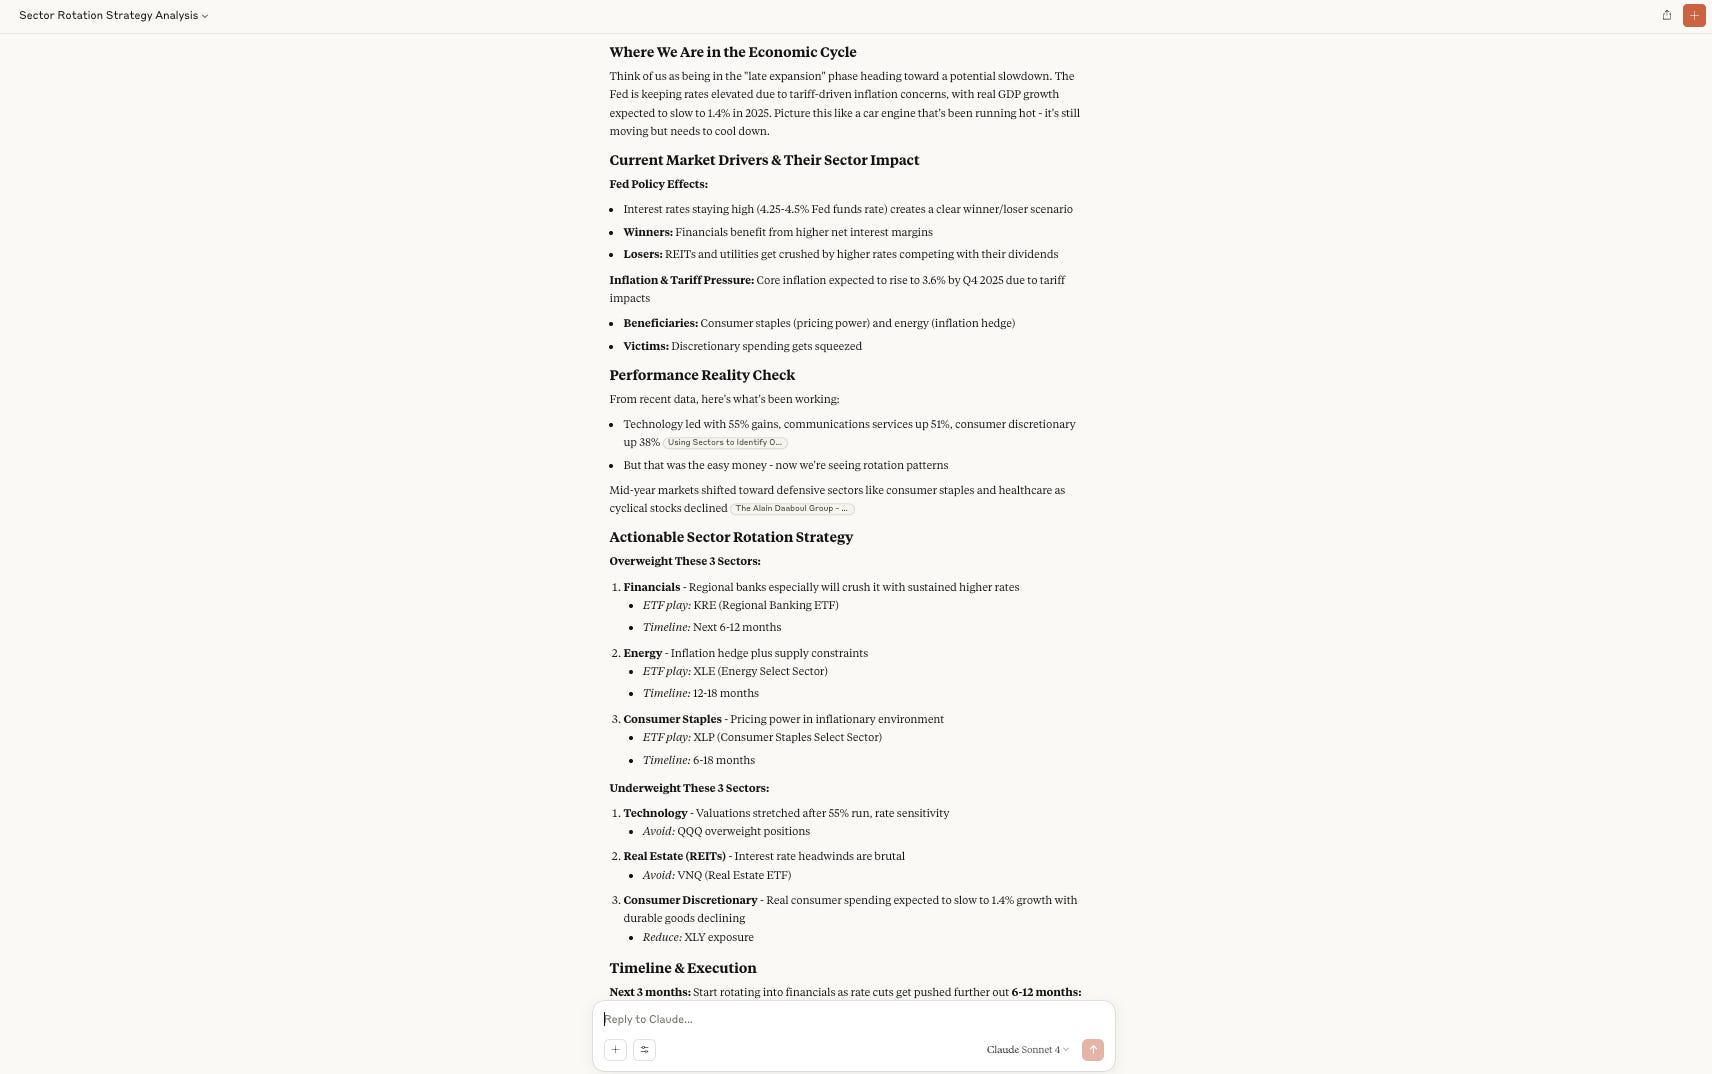
2. Sector Rotation
Perfect for spotting which industries to favor when economic conditions shift and where smart money is rotating capital.
<role>Macro strategist specializing in sector analysis</role>
<task>Identify sector rotation opportunities based on current market conditions</task>

<analysis_focus>
**Economic Cycle Analysis:**
- Where are we in the economic cycle?
- Which sectors typically outperform in this phase?

**Current Market Drivers:**
- Fed policy impacts by sector
- Inflation effects on different industries
- Geopolitical factors affecting specific sectors

**Relative Performance:**
- Best/worst performing sectors (YTD)
- Valuation disparities between sectors
- Earnings revision trends by sector

**Actionable Opportunities:**
- 2-3 sectors to overweight
- 2-3 sectors to underweight
- Specific ETFs or stocks to consider
- Timeline for these moves
</analysis_focus>

<constraints>Base recommendations on data from the last 3 months, include both fundamental and technical factors</constraints>
Output:
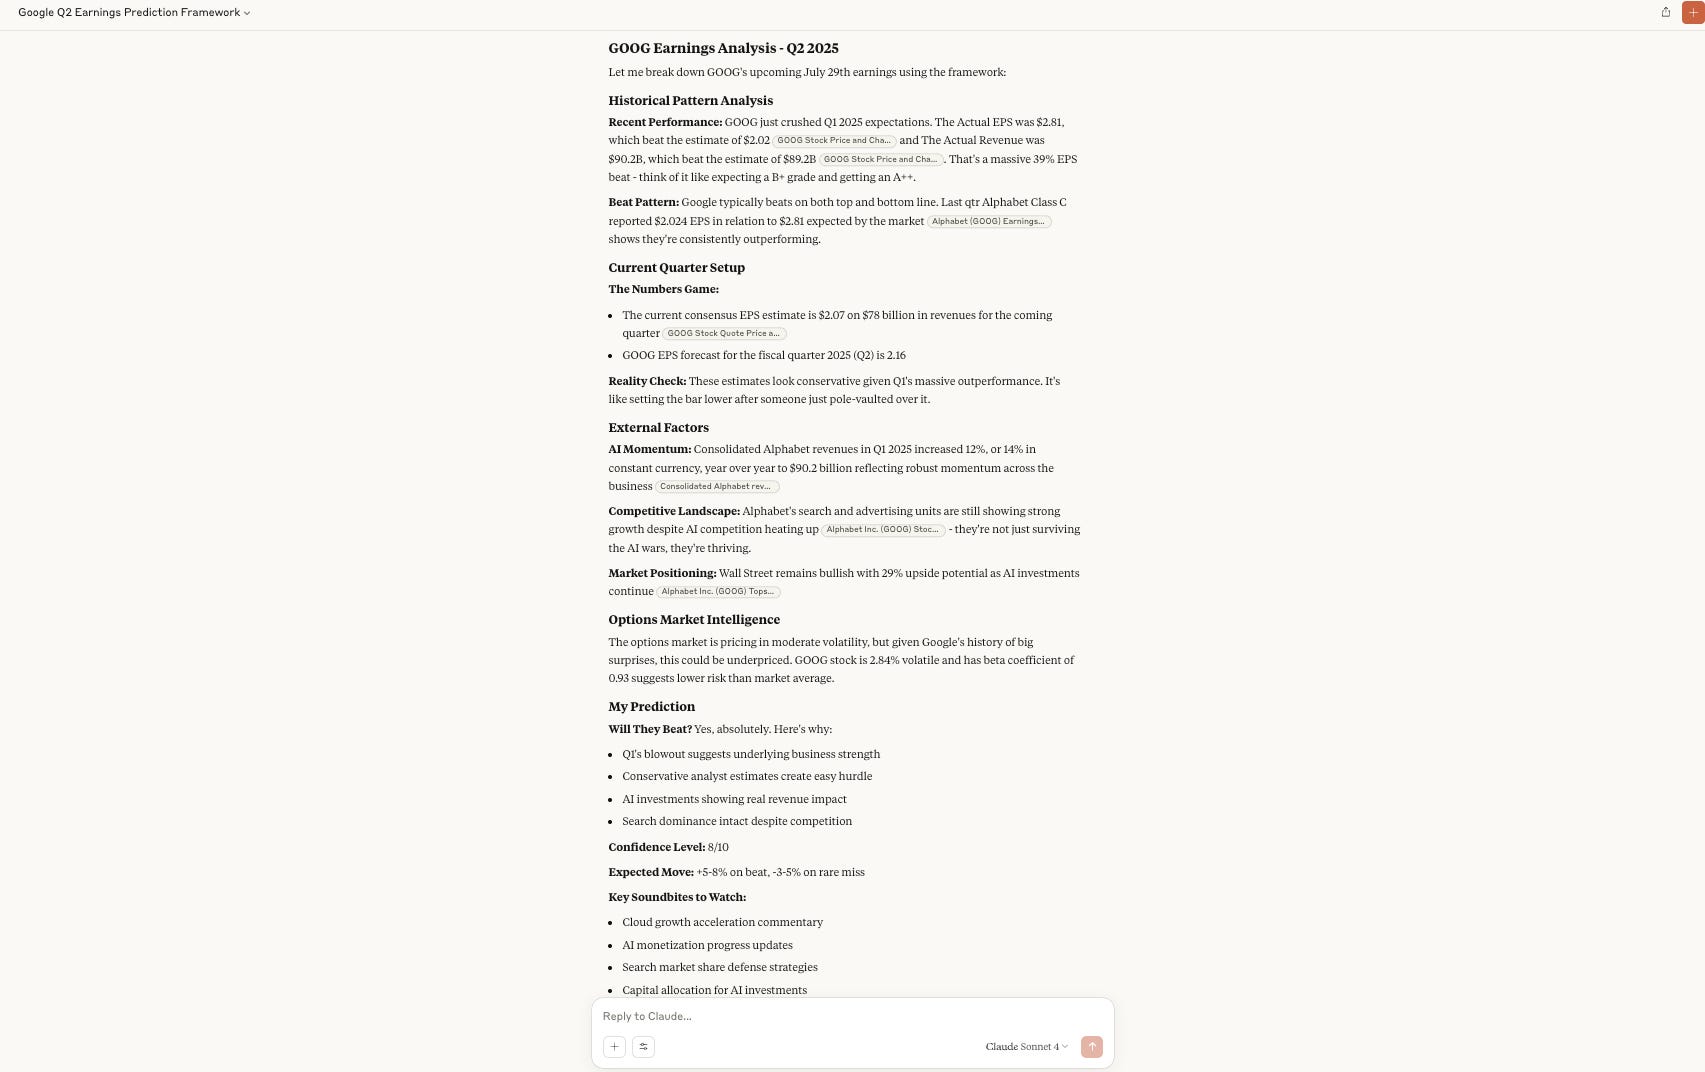
3. Earnings Anticipation
Deploy this 48 hours before earnings to gauge surprise potential and position accordingly based on historical patterns and current setup.
<role>Earnings analyst with access to comprehensive financial data</role>
<company>[COMPANY TICKER]</company>
<upcoming_earnings>[EARNINGS DATE]</upcoming_earnings>

<prediction_framework>
**Historical Pattern Analysis:**
- Last 8 quarters: beat/miss pattern
- Average surprise percentage
- Stock reaction to beats vs misses

**Current Quarter Setup:**
- Consensus estimates vs whisper numbers
- Management guidance vs street expectations
- Key metrics to watch (company-specific)

**External Factors:**
- Industry trends affecting this quarter
- Macro headwinds/tailwinds
- Supply chain or regulatory impacts

**Options Market Intelligence:**
- Implied volatility vs historical moves
- Unusual options activity
- Smart money positioning

**My Prediction:**
- Will they beat/meet/miss?
- Confidence level (1-10)
- Expected stock reaction (+/- %)
- Key soundbites to listen for on the call
</prediction_framework>
Output:

4. Risk Management Check
Objective position evaluation and behavioral bias elimination for existing holdings.
<role>Risk management specialist and behavioral finance expert</role>
<portfolio_context>Current position: [STOCK/AMOUNT], Portfolio weight: [X%]</portfolio_context>

<risk_assessment>
**Position Sizing Analysis:**
- Is this position size appropriate for my risk tolerance?
- What's my maximum acceptable loss on this position?
- How does this correlate with my other holdings?

**Behavioral Bias Check:**
- Am I suffering from confirmation bias?
- Is this a FOMO trade or logical decision?
- What would I tell a friend in this situation?

**Scenario Planning:**
- Best case scenario (probability and return)
- Base case scenario (probability and return)
- Worst case scenario (probability and loss)

**Exit Strategy Framework:**
- Clear profit-taking levels
- Stop-loss levels (technical and fundamental)
- Time-based exit criteria
- What news would make me sell immediately?

**Action Items:**
- Should I add to, hold, or reduce this position?
- What's my next portfolio move?
</risk_assessment>

<output_format>Be brutally honest, challenge my assumptions, focus on what could go wrong</output_format>
Output:
5. Market Sentiment Analysis
Most valuable during market extremes when emotions create the best risk-adjusted opportunities through crowd psychology mispricings.
<role>Market psychology expert and sentiment analyst</role>
<timeframe>Current market conditions as of [TODAY'S DATE]</timeframe>

<sentiment_analysis>
**Fear & Greed Indicators:**
- VIX levels and trend
- Put/call ratios
- Margin debt levels
- Insider buying/selling activity

**Retail vs Institutional Behavior:**
- Retail sentiment signals (social media, app usage)
- Smart money moves (13F filings, unusual options)
- Divergences between retail and institutional positioning

**Contrarian Opportunities:**
- What is everyone talking about? (potential fade)
- What is everyone ignoring? (potential opportunity)
- Extreme positioning to exploit

**Market Timing Insights:**
- Are we in a fear or greed extreme?
- Historical precedents for current sentiment levels
- Probable market direction over next 2-4 weeks

**Trading Strategy:**
- Should I be buying dips or selling rallies?
- Specific contrarian plays to consider
- Risk management for current environment
</sentiment_analysis>

<perspective>Focus on actionable insights, not just description. What should I DO based on this sentiment?</perspective>
Output:
Conclusion
AI won't replace your entire stock research process (at least not now), but it'll make your research faster and more systematic.
Start Simple, and pick one prompt and test it with a stock you know well. See how the analysis compares to your own research.
And, please don’t forget to verify EVERYTHING. AI is brilliant for structure and ideas, but always fact-check the numbers and claims against official sources.
What’s next?
In the next issue, I’ll show you how to combine Perplexity with Google’s NotebookLM for deeper, more reliable investment insights.
Thank you for reading. Hope you have an awesome week!
You can always support my work by buying me a coffee (or two😉). Thank you🙏
Disclaimer: This publication and its authors are not licensed investment professionals. The information provided in this publication is for educational purposes only and should not be construed as investment advice. We do not make any recommendations regarding the suitability of particular investments. Before making any investment decision, it is important to do your own research. RhinoInsight assume no liability for any investment decisions made based on the information provided in this newsletter.
Really great post, thank you! Have you found a way to improve data and decrease "hallucinations"?